


Renewable energy set new records in 2015 for dollar investment, the amount of new capacity added and the relative importance of developing countries in that growth. All this happened in a year in which prices of fossil fuel commodities – oil, coal and gas – plummeted, causing distress to many companies involved in the hydrocarbon sector. So far, the drivers of investment in renewables, including climate change policies and improving cost-competitiveness, have been more than sufficient to enable renewables to keep growing their share of world electricity generation at the expense of carbon-emitting sources.
Reducing the risks of climate change requires urgent action now. The Paris Agreement, universally adopted in December 2015 by all Parties to the United Nations Framework Convention on Climate Change, finally provides the policy signals the private sector has asked for to help accelerate the low-carbon transformation of the global economy.
We have entered a new era of clean energy growth that can fuel a future of opportunity and greater prosperity for every person on the planet. Governments, businesses and investors around the world are realising that the progression to low-emission, climate-resilient growth is inevitable, beneficial and already under way.
Last year saw global investment in renewables rise 5% to $285.9 billion, taking it above the previous record of $278.5 billion reached in 2011 at the peak of the ‘green stimulus’ programmes and the German and Italian rooftop solar booms. Figure 1 shows that the 2015 total was more than six times the figure set in 2004, and that investment in renewables has been running at more than $200 billion per year for six years now. Over the 12 years shown on the chart, the total amount committed has reached $2.3 trillion.
Figure 1. Global New Investment in Renewable Energy by Asset Class, 2004-2015, $BN
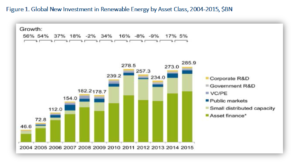
*Asset finance volume adjusts for re-invested equity. Total values include estimates for undisclosed deals
Source: UNEP, Bloomberg New Energy Finance
More impressive in a way than the new dollar investment record set last year was the result in terms of gigawatts of capacity added. In 2015, some 134GW of renewables excluding large hydro were commissioned, equivalent to some 53.6% of all power generation capacity completed in that year – the first time it has represented a majority. Of the renewables total, wind accounted for 62GW installed, and solar photovoltaics 56GW, record figures and sharply up from their 2014 additions of 49GW and 45GW respectively.
Figure 2 shows the make-up of the record investment figure in 2015. At the left edge of the chart are the categories relating to the backing of early-stage companies and technology. Venture capital investment in renewables was $1.3 billion last year, up 36% but still far behind its peak level of $3.2 billion in 2008. Next along is corporate and government research and development spending on renewables. The former was up 3% on the previous year at $4.7 billion and the latter down 3% at $4.4 billion. Private equity expansion capital was $2.1 billion in 2015, up 32% on 2014 but less than a third of the peak, 2008 figure of $6.7 billion. The last part of that technology/corporate level funding is equity raising by specialist renewable energy companies on the public markets. This was $12.8 billion last year, down 21% on the previous 12 months but close to its average over the last eight years.
The biggest components of investment in 2015 were asset finance of utility-scale projects such as wind farms and solar parks, at $199 billion, some 6% above the previous year, and spending on small distributed capacity – local and rooftop solar projects of less than 1MW capacity – which was up 12% at $67.4 billion. There is also an adjustment of $5.8 billion for reinvested equity (money that was raised in the categories on the left of Figure 2 that then ended up going into asset finance or small projects). Finally, on the right of Figure 2 is acquisition activity of $93.9 billion, up 7%. This is a mix of asset acquisitions, refinancings, corporate mergers and takeovers, and buy-outs.
Figure 2. Global Transactions in Renewable Energy, 2015, $BN
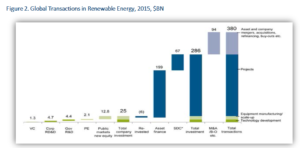
SDC = small distributed capacity. Total values include estimates for undisclosed deals. Figures may not add up exactly to totals, due to rounding.
Source: UNEP, Bloomberg New Energy Finance
The regional split of investment in 2015 has been demonstrated by the stand-out contribution to the rise in investment to a new record came from China, which lifted its outlays by 17% to $102.9 billion, some 36% of the global total. Investment also increased in the US, up 19% at $44.1 billion; in Middle East and Africa, up 58% at $12.5 billion, helped by project development in South Africa and Morocco; and in India, up 22% at $10.2 billion. However, it fell in Europe by 21% to $48.8 billion, that continent’s lowest figure for nine years – despite record commitments to offshore wind projects. Investment fell 10% to $7.1 billion in Brazil, and was also slightly lower in the Americas excluding the US and Brazil, at $12.8 billion, largely due to a weaker Canadian figure; and in Asia excluding China and India, at $47.6 billion.
Developing World Ahead
Renewable energy technologies such as wind and solar used to be seen by some critics as a luxury, affordable only in the richer parts of the world. This has been an inaccurate view for a long time, but 2015 was the first year in which investment in renewables excluding large hydro was higher in developing economies than in developed countries. Figure 4 shows that the developing world invested $156 billion last year, some 19% up on 2014 and a remarkable 17 times the equivalent figure for 2004, of $9 billion. Developed countries invested $130 billion in 2015, down 8% and their lowest tally since 2009.
A large part of the record-breaking investment in developing countries took place in China. Indeed, that country has been the single biggest reason for the near-unbroken uptrend for the developing world as a whole since 2004. However, it was not just China – India also raised its commitment to renewables in 2015, and developing countries excluding China, India and Brazil lifted their investment by 30% last year to an all-time high of $36 billion, some 12 times their figure for 2004.
Among those “other developing” economies, those putting the largest sums into clean power were South Africa, up 329% at $4.5 billion as a wave of projects winning contracts in its auction programme reached financial close; Mexico, 105% higher at $4 billion, helped by funding from development bank Nafin for nine wind projects; and Chile, 151% higher at $3.4 billion, on the back of a jump in solar project financings. Morocco, Turkey and Uruguay also saw investment beat the $1 billion barrier in 2015.
Investment in the developed world has been on a downward trend, more or less consistently, since 2011, when it peaked at $191 billion, some 47% higher than the 2015 outturn. This decline has been a little to do with the US, where there was a rush of investment in 2011 as projects and companies tried to catch the Treasury grant and Federal Loan Guarantee programmes before they expired; but much more to do with Europe, where allocations fell by 60% between 2011 and 2015. That big drop reflected a mix of factors including retroactive cuts in support for existing projects in Spain, Romania and several other countries, an economic downturn in southern Europe that made electricity bills more of a political issue, the fading of solar booms in Germany and Italy, and the big fall in the cost of PV panels over recent years. The two factors pushing in the opposite (positive) direction in Europe in recent years have been strong investment in the UK, and the growth of the offshore wind sector in the North Sea.
Figure 4. Global New Investment in Renewable Energy: Developed V Developing Countries, 2004-2015, $BN
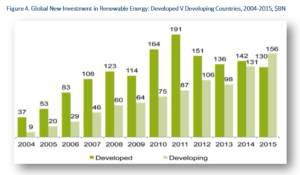
New investment volume adjusts for re-invested equity. Total values include estimates for undisclosed deals. Developed volumes are based on OECD countries excluding Mexico, Chile, and Turkey.
Source: UNEP, Bloomberg New Energy Finance
Figure 5 shows the sector split for global investment. Over recent years, renewables have become more and more dominated by wind and solar, with the smaller sectors losing relative importance, and in 2015 this process continued. Solar saw a 12% increase to $161 billion, and wind a 4% boost to $109.6 billion – both records, although not by as huge a margin as their gigawatt installation figures. (There are several reasons why GW installations grew more quickly than dollar investment in 2015 for wind and solar. One was the rise in the US currency, which depressed dollar figures for projects in euro, yen, yuan and other currency zones. A second was lower costs per MW in solar. A third was the growing share of China in overall investment. Chinese wind and solar projects are typically at the low end of the global cost range.) Biomass and waste-to-energy suffered a 42% fall to $6 billion; small hydro projects of less than 50MW a 29% decline to $3.9 billion; biofuels (the second-biggest sector behind wind back in 2006) a 35% drop to $3.1 billion; geothermal a 23% setback to $2 billion; and marine (wave and tidal) a 42% slip to just $215 million.
Figure 5. Global New Investment in Renewable Energy by Sector, 2015, And Growth On 2014, $BN

New investment volume adjusts for re-invested equity. Total values include estimates for undisclosed deals.
Source: UNEP, Bloomberg New Energy Finance
The split was somewhat different for venture capital and private equity funding specifically. This type of money tends to go to the newer technologies, rather than the more mature ones, so it is no surprise in Figure 6 to see solar dominating with $2.4 billion last year, up 58%, and biofuels – particularly second-generation based on non-food crops – come second with $523 million, down 3%. Solar also took the lion’s share of public market investment in 2015, at $10.1 billion in Figure 7, up 21%, with wind second at $2 billion, down 69%. However, the public market figures were heavily influenced last year by equity issuance from North American ‘yieldcos’ and European quoted project funds, many of which own projects in both solar and wind, so the sector split for their fundraisings is somewhat arbitrary.
Figure 6. Venture Capital and Private Equity (VC/PE) New Investment in Renewable Energy by Sector, 2015, $BN
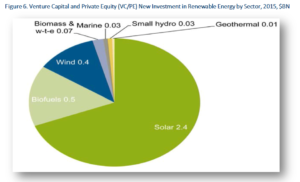
Source: UNEP, Bloomberg New Energy Finance
Figure 7. Public Markets New Investment in Renewable Energy by Sector, 2015, $BN

Source: UNEP, Bloomberg New Energy Finance
The really big financial flows to renewable energy in 2015 came at the roll-out stage, rather than the technology development stage. Figure 8 shows that solar (utility-scale and small-scale) was by far the largest sector for capacity investment, reaching $148.3 billion, up 12% on the year before. As well as conventional solar parks and rooftop installations, last year saw the financing of a number of floating solar photovoltaic projects on lakes and reservoirs, mostly in the single-digit MW range.
Commitments for new wind capacity rose 9% to $107 billion. Perhaps more interesting was the sub-sector split with onshore wind garnering $83.8 billion, up 3%, while offshore wind attracted a record $23.2 billion, up 39% compared to 2014, mostly in Europe but also including a first wave of Chinese sea-based projects. The offshore wind arrays financed worldwide last year were more than 20 in number, with eight of them having estimated project costs of between $1 billion and $2.9 billion. There was also a 30MW floating offshore wind project financed in Scotland.
Figure 8 also shows the capacity investment comparison between wind and solar and the smaller clean energy sectors, the largest of which was biomass and waste-to-energy at $5.2 billion, and also between all of those and large hydro. Some $43 billion of large hydro-electric projects of more than 50MW are estimated to have reached the ‘final investment decision’ stage in 2015, down 7% on the previous year. This would put large hydro at 40% the size of wind in terms of new investment last year, and just 29% of the size of solar, although of course prior decades of development mean that the installed base of 50MW-plus hydro-electric dams is still, at around 925GW, much bigger than that of wind and solar (671GW combined).
Figure 8. Renewable Energy Asset Finance and Small Distributed Capacity Investment by Sector, 2015, And Growth On 2014, $BN
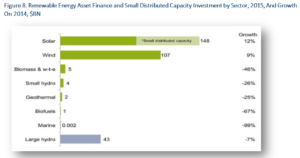
Total values include estimates for undisclosed deals.
Source: UNEP, Bloomberg New Energy Finance
Energy Abundant, Competition On Costs
The global energy sector has changed out of all recognition since the summer of 2014. Oil, as measured by the Brent crude contract, fell in price from a high of $115.71-a-barrel on 19 June of that year, to $27.10 on 20 January 2016, a decline of 76%. The ARA coal contract dropped from $84-a-tonne on 28 April 2014 to $36.30 on 17 February 2016, intensifying a downward trend that has been unfolding since its high of $135 in 2011. The US Henry Hub natural gas price slid from around $4.50 per MMBtu in June 2014 to $1.91 in mid-February 2016.
However, cheaper fossil fuels have not materially damaged prospects for renewables so far. Competition between fossil fuels and renewables is rarely a simple one-or-other choice. Oil does not compete directly with renewable power, except in a few crude-producing countries that burn oil to make electricity, and in remote regions using diesel generators. Gas does compete more directly with wind and solar, but while gas prices in Europe and Asia have fallen, they remain far above US levels. Coal also competes with renewables but, as with gas, decision-makers are unlikely to make power station choices on the basis of short-term spot commodity prices. In addition, new coal-fired plants may be more difficult to finance than those of cleaner technologies, given rising investor concern about exposure to stranded assets and the climate priorities of development banks.
Meanwhile, renewables have their own advantages. Wind farms can be built in nine months or so, solar parks in three-to-six months, whereas coal and gas plants take several years, and nuclear even longer. So developing countries in a hurry for new capacity may opt for speed. And, while fossil fuel costs have been falling, renewables and especially solar have also been getting more competitive.
Figure 9 shows the change in levelised costs of electricity (LCOE) for four different renewable power technologies over a six-year period. Onshore wind has seen its average global LCOE decline from $96 per MWh in the third quarter of 2009 to $83 per MWh in late 2015, a reduction of 14%. The equivalent for offshore wind actually increased for several years, as projects moved out into deeper water, but have started to come down more recently. Average costs were around $174 per MWh in the second half of last year. The LCOE for solar thermal parabolic trough plants has hardly changed and remains around $275 per MWh.
The spectacular mover has been solar photovoltaics, the biggest single sub-sector in renewables. The average global levelised cost for crystalline-silicon PV has plummeted from $315 per MWh in Q3 2009 to $122 in late 2015, a drop of 61%, reflecting deflation in module prices, balance-of-plant costs and installation expenses. And there is an advance guard of projects taking place in particular countries now at much lower.
Many governments in developed and developing countries are moving towards auctions as a way of awarding capacity to renewable energy developers at relatively keen prices – continuing a trend that was discussed in last year’s Global Trends report. In South Africa, for instance, the 2015 auctions awarded contracts to onshore wind at 41% less in local currency terms than the first auctions, back in 2011. In the UK, the first Contract-for-Difference auction, held in February 2015, saw winning bids for onshore wind at 11% below what was available under the preceding green certificate regime. Two contracts for offshore wind were awarded at 14% and 18% below the officially-set strike price. In Germany, the second PV auction in 2015 awarded contracts 7.5% below the previous feed-in tariff level.
None of this means that all obstacles for renewables have gone away, far from it. Challenges include national electricity monopolies in some developing countries that are not familiar with, or are resistant to, variable wind and solar generation. Then there are concerns in many developed economies about how variable generation can be balanced, and how it can be guaranteed that the lights will stay on. There are depressed wholesale electricity prices in many developed countries that are making it difficult to make a return on investing in any new generating plant, renewable or otherwise. There is a lack of investor confidence in a number of significant countries because of past political events or energy policy decisions, from Ukraine to Spain, and Argentina to Greece.
Figure 9. Global Average Levelised Cost of Electricity for Wind and Solar, Q3 2009 To H2 2015, $ Per MWh
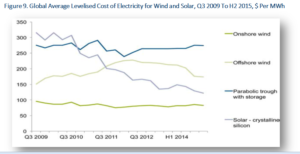
Source: Bloomberg New Energy Finance
In some countries, local financing options are plentiful; in others they are few and far between. And some jurisdictions have local regulations that make renewables difficult to develop, even if the natural resource is good – small-scale solar in Turkey being one of the many examples. Finally, there are also issues resulting from rapid build-out of renewables. One important example is curtailment of new wind farms in China, as the grid struggles to match electricity demand that is growing less rapidly than before with increased power generation capacity.
